DATA FROM EIRGRID SHOWS AVERAGE CO2 LEVELS HAVEN'T CHANGED DESPITE NEW WIND CAPACITY
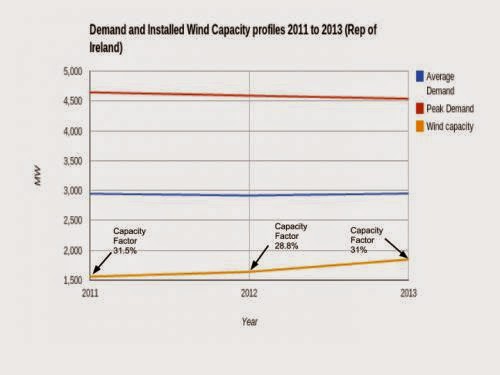
Eirgrid publish CO2 emissions and CO2 intensity levels every quarter hour for the Irish system. When the data is extracted for the last three years, the results show, that on average, there has been no reduction in CO2 emissions from electricity generation. As can be seen in the first graph below, about 290MW of installed wind capacity was added to the system between 2011 and 2013. The capacity factor of wind (a higher percentage means higher winds), dropped in 2012 but by 2013 was back up to 31%. Demand remained relatively static, if anything we should be seeing a slight drop in CO2 emissions in line with the slight reduction in peak demand.
So with the extra wind capacity in the system and good wind speeds in 2013, we should have seen a drop in the average CO2 for the year when compared to 2011. Instead, we are back where we began in 2011. This would tend to indicate, as Colm McCarthy and ESB have recently stated, that we have reached saturation point with wind energy :
We can see that there was a slight increase in CO2 emissions in 2012, which could be attributed to the drop in the capacity factor of wind but more likely due to a change in fuel mix [see note below]. But for 2011 and 2013, CO2 intensity levels at every range - peak, low and average are almost identical despite the additional energy from wind.
These CO2 figures are also a good indication of fossil fuel used in electricity generation. So are the figures for fossil fuel savings claimed by the Irish authorities real or illusory ? Do they only exist in computer models ? The problem, as explained in an earlier blog, is that an additional MW of wind added to the system, does not always result in the replacement of a MW from conventional sources. The more wind that is added to the system, the more inefficient the use of fossil fuel generators. Running them inefficiently results in more fossil fuel use, and hence more CO2 emissions. In 2013, this problem resulted in the offset of the benefits from the additional "clean" wind energy let into the system.
This means that if the plans for the doubling of wind capacity go ahead, we could actually see the reversal in the downward trend of CO2 emissions in the coming years.
SOMEBODY HAS CONTACTED ME ASKING ABOUT THE FUEL MIX FOR THESE YEARS. A QUICK LOOK AT THE DIRTIEST ELEMENTS OF THE FUEL MIX (PEAT AND COAL) FOR 2011 TO 2013 SHOWS THE FOLLOWING :
SO IN 2012, THE SPIKE IN CO2 EMISSIONS CAN BE MAINLY ATTRIBUTED TO THE INCREASED USE OF PEAT AND PRIMARILY COAL USE IN THE FUEL MIX. THEN IN THE FOLLOWING YEAR, LESS COAL AND PEAT WAS USED THAN IN BOTH THE PRECEDING YEARS. SO, EVEN WITHOUT ANY ADDITIONAL WIND, WE SHOULD SEE A DROP IN CO2 EMISSIONS IN 2013 (ALSO CONSIDER THE DROP IN PEAK DEMAND AS WELL). BUT INSTEAD, WE SEE NO DROP. THIS THEN WOULD SEEM TO SUPPORT MY INITIAL CONCLUSION THAT THE INEFFICIENCIES CREATED BY LARGE AMOUNTS OF WIND IN THE SYSTEM LEAD TO INCREASED CO2 EMISSIONS.
IN 2013, THE EAST WEST INTERCONNECTOR MADE UP THAT SHORTFALL IN COAL AND PEAT USE, IN EFFECT REPLACING IRISH COAL POWER WITH UK COAL POWER. AS IMPORTED POWER IS NOT ACCOUNTED FOR IN EIRGRID'S CO2 EMISSIONS (ALTHOUGH EXPORTED POWER IS, BUT THIS IS RELATIVELY SMALL), THIS FURTHER STRENGTHENS THE CASE THAT AVERAGE CO2 EMISSIONS SHOULD HAVE DROPPED IN 2013.
I WELCOME ANY OTHER ANALYSIS FROM OTHER PARTIES, FROM THE WIND INDUSTRY OR ELSEWHERE, INTO WHAT THEY THINK IS GOING ON HERE.


0 comments:
Post a Comment